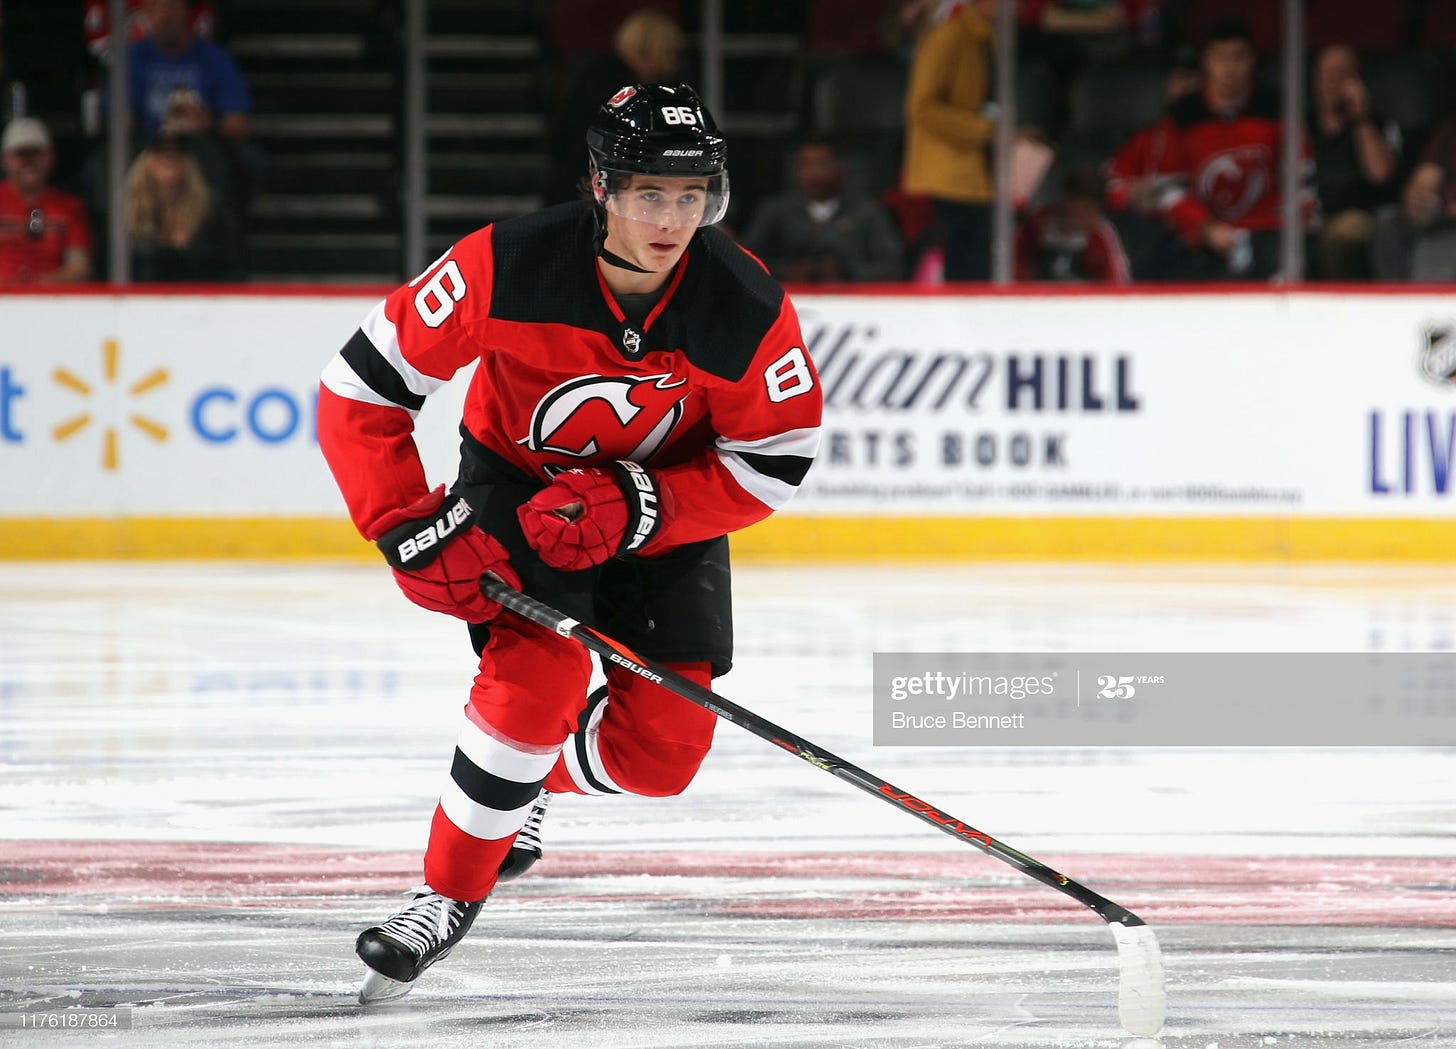
Player Development Analytics: Jack Hughes Case Study
Studying the NJD forward's progress from 2018-2020
In the past two seasons Jack Hughes has experienced highs and lows in his hockey career.
As a junior Hughes was a generational performer. He finished his US National Team Development career averaging over two points per game and was drafted first overall in 2019 by the New Jersey Devils.
But so far as an NHLer he has struggled. In his rookie season with NJD he scored at one-sixth of his USHL offensive pace while being heavily out-played at even-strength.
Performance Metrics
The first lens through which to objectively evaluate Hughes’ progress is via performance metrics - how much value does Hughes provide to his team when he is on the ice, relative to his level of competition.
Hughes’ rookie-season blues essentially revolve around his inability to “drive play” for the NJD whether he played at center or on left wing. When the 19 year old was on the ice, the Devils only controlled 45.8% of on-ice 5v5 shots - a terrible mark for a skilled player even on a non-playoff team.
As friend of the newsletter JFresh illustrates in the chart below, Hughes is among the worst players in the NHL at generating shot volume for (1st percentile) and preventing shot volume against (10th percentile).
Hughes’ undeniably elite skills do show up in his ability to create primary assists at 5v5 (above-average) and at creating offense on the powerplay (88th percentile).
Developmental Metrics
Performance metrics such Corsi (raw shot rates), RAPM (context-adjusted shot rates) and WAR (one-number metrics) do a good job of valuating a player’s contributions relative to their peers. They provide objective, actionable evidence to inform trades, free agent signings and roster design.
But what about in a player development context, where we care more about evaluating an athlete’s progress relative to him/herself?
Darryl Belfry describes a different data-oriented approach in his recent book. Having worked with him in the TOR organization, I’ve grown to appreciate his methodology, which revolves around the idea of frequency and success rate.
Simply put, when working with players looking to optimize their game, we should track data related to how often a player executes certain actions (frequency) and how often those actions lead to a continuation play (success rate):
High frequency/high success rate (LEVERAGE): These are a player’s core strengths - we want to leverage these skills when working on weaknesses, and continue to build on them over time
Low frequency/high success rate (EXTEND): We want to research and develop ways to deploy these skills more often in-game
High frequency/low success rate (ADDRESS): These are the most valuable development opportunities - any gains we make here will scale and multiply
Low frequency/low success rate (IGNORE): We skip over these issues to focus on other areas
It is possible to develop, test and refine a whole suite of metrics based on this very simple principle. This is something that Darryl, Adam Nicholas and I have worked independently on for the past few years.
Case Study: Jack Hughes
For me the simplest way to illustrate how and why Hughes struggled in 2019-20 is to take you back to his 2018-19 season with the US NTDP U18 team, then work forward to present-day.
As a NTDP player Hughes played on a high-powered team featuring a dozen NHL draft picks and was by far its most noticeable and productive skater. But already we could see some evidence of how he might struggle against older, stronger, faster and more experienced opponents.
October 20, 2018 - U18 vs Harvard (NCAA D1)
Hughes 5v5 on-ice: 41% Corsi (17 shots for, 24 against)
Hughes 5v5 puck play success rate: 50% (12 successful plays, 24 touches total)
Struggled to control play at 5v5. Very low success rate and decent frequency against older players.
October 27, 2018 - U18 vs Muskegon (USHL)
Hughes 5v5 on-ice: 56% Corsi (15 shots for, 12 against)
Hughes 5v5 puck play success rate: 79% (15 successful plays, 19 touches total)
Optimal success rate and decent frequency against age peers.
March 27, 2019 - U18 vs Youngstown (USHL)
Hughes 5v5 on-ice: 70% Corsi (28 shots for, 12 against)
Hughes 5v5 puck play success rate: 79% (26 successful plays, 33 touches total)
Optimal success rate AND frequency in a dominant showing against peers.
October 4, 2019 - NJD vs WPG (playing mostly C)
Hughes 5v5 on-ice: 26% Corsi (7 shots for, 20 against)
Hughes 5v5 puck play success rate: 54% (14 successful plays, 26 touches total)
Good frequency (1 puck touch per 28 seconds of 5v5 play) but poor success rate; poor on-ice shot impacts.
March 7, 2020 - NJD vs WPG (playing mostly LW)
Hughes 5v5 on-ice: 50% Corsi (11 shots for, 11 against)
Hughes 5v5 puck play success rate: 68% (19 successful plays, 28 touches total)
Frequency remains good, now with better success rate.
Want to know more about what elite NHLers do to improve?
If you enjoy this newsletter and want to see more free content, consider ordering a copy of my e-book Hockey Tactics 2020, edited by a legendary journalist and illustrated by an artist whose work you have surely already seen. Eight chapters, more timely insights, more timeless principles. Get it now
Photo: Getty
Additional statistics: Natural Stat Trick & Hockey Reference


